Image Details
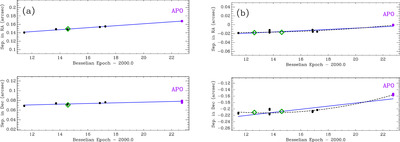
Caption: Figure 13.
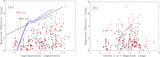
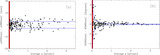
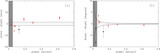
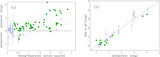
Motion of the stellar secondary relative to the primary over time for (a) Kepler-449, and (b) Kepler-907 (see Section 7.2). In both plots, the filled circles represent observations taken earlier in our program and reported in Colton et al. (2021), the purple filled circles on the right marked “APO” indicate the new data appearing in Table 3, and green diamonds are results from Kraus et al. (2016). The blue lines indicate the best-fit linear solution to the speckle data on our program, and for Kepler-907, the dashed curves indicate the best-fit parabolic solution.
Other Images in This Article


Show More
Copyright and Terms & Conditions
© 2024. The Author(s). Published by the American Astronomical Society.
Copyright ©
2026 Astronomy Image Explorer. All Rights Reserved.