Image Details
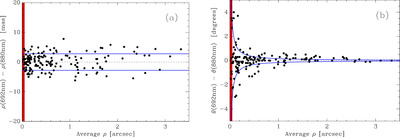
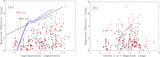
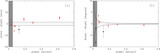
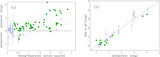
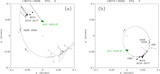
Caption: Figure 7.
Differences in the astrometric results obtained between paired DSSI observations at the same epoch. (a) Differences in separation as a function of average separation. (b) Differences in position angle as a function of average separation. In both plots, a dashed line at a difference of zero is drawn to guide the eye, and the blue curves indicate the ±1σ in estimated internal repeatability of individual measures as a function of separation as discussed in the text. For differences in separation, that repeatability metric is simply the standard deviation of the measures and, for position angle, it is proportional to ﹩\arctan (\delta \rho /\rho )﹩. In both (a) and (b), the red bar at the left marks the region below the formal diffraction limit.
Other Images in This Article

Show More
Copyright and Terms & Conditions
© 2024. The Author(s). Published by the American Astronomical Society.