Image Details
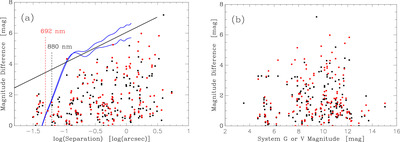
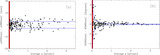
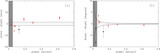
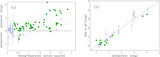
Caption: Figure 6.
(a) Magnitude difference as a function of separation for all observations from the first year of operation. (b) Magnitude difference as a function of system V magnitude. In both panels, the color of the plot symbol indicates the filter wavelength used for the observation: red is 692 nm and black is 880 nm. Dashed vertical lines show the diffraction limit of the ARC 3.5 m telescope for the corresponding wavelength. In (a), the blue curves indicate typical detection limit curves for APO observations (see Horch et al. 2015 for details on how these are created) and the black line is the estimated detection limit for DSSI on the ARC 3.5 m telescope, drawn such that it roughly matches the blue curves above a separation of 0.″1.
Other Images in This Article
Show More
Copyright and Terms & Conditions
© 2024. The Author(s). Published by the American Astronomical Society.