Image Details
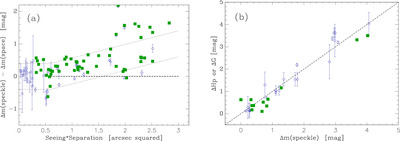
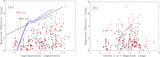
Caption: Figure 9.
A comparison of photometric results obtained here with those of both Hipparcos and Gaia. (a) Magnitude difference in the 692 nm filter as a function of seeing times separation. The dotted blue lines indicate the approximate range of points in the same plot in our previous paper in this series (Horch et al. 2021). (b) For those systems with seeing times separation less than 0.6 arcsec2, the space-based magnitude difference is shown as a function of the speckle magnitude difference at 692 nm. Here, the dotted line indicates the line y = x. In both plots, the open blue diamonds are derived from Hipparcos data and the filled green squares are derived from Gaia DR3 results. The error bars for Hipparcos points are those stated in the Hipparcos Catalogue, and the errors listed in the DR3 catalog for the Gaia points are typically smaller than the plot symbol.
Other Images in This Article


Show More
Copyright and Terms & Conditions
© 2024. The Author(s). Published by the American Astronomical Society.