Image Details
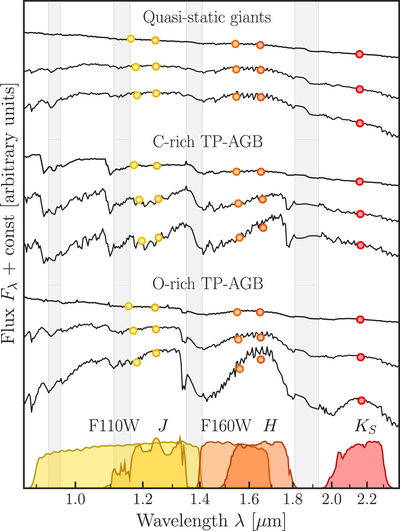
Caption: Figure 1.
Schematic comparison of NIR stellar spectra (black lines; Verro et al. 2022a) and their integrated flux densities (colored points, plotted at respective effective wavelengths) for three broad classes of cool and luminous giants. These include nonpulsating AGB and upper RGB stars (upper three), and TP carbon-rich (center) and oxygen-rich (lower) AGB stars, respectively. Transmission curves for the 2MASS JHK S and HST F110W and F160W bandpasses are shown as filled curves at the bottom, and regions with significant atmospheric telluric absorption are marked by gray vertical bands.
Other Images in This Article
Show More
Copyright and Terms & Conditions
© 2023. The Author(s). Published by the American Astronomical Society.