Image Details
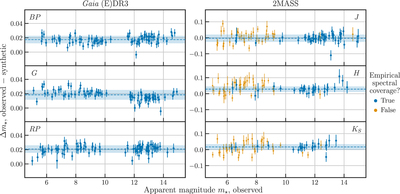
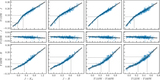
Caption: Figure 5.
Differences between observed and synthetic magnitudes in Gaia (E)DR3 BP, G, and RP (left) and 2MASS JHK S (right) as functions of observed magnitude for select CALSPEC stars. Blue points indicate empirical spectrophotometry (available for effectively all CALSPEC stars in the optical), and orange indicates spectra extrapolated from theoretical models (e.g. missing WFC3/IR and/or NICMOS data), which we exclude from calculations and show only for reference. Blue dashed lines and solid bands show the weighted means and standard deviations of the photometric offsets, as reported in Table 2.
Other Images in This Article
Show More
Copyright and Terms & Conditions
© 2023. The Author(s). Published by the American Astronomical Society.