Image Details
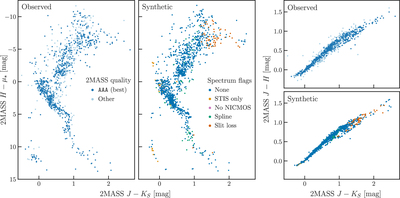
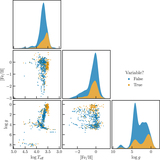
Caption: Figure 6.
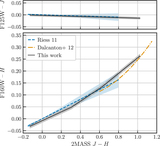
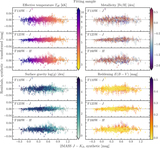
Left: absolute H vs. J − K S CMD of all available 2MASS photometry for our full sample. Here, dark blue points indicate sources with high-quality 2MASS photometry in all bands (Qflg=AAA) and light blue indicates nonoptimal quality flags in one or more bands. Center: the same CMD for our synthetic photometry suite. Blue points indicate spectra with no data caveats. Orange indicates CALSPEC library stars that were observed only with STIS, where the spectra are filled in outside the STIS wavelength range (≳1 μm) using theoretical spectra. Green indicates XSL spectra that were corrected for slit loss via spline fitting (Verro et al. 2022b), and red indicates XSL spectra uncorrected for slit loss. Right: the same in J − H vs. J − K S color–color space.
Other Images in This Article
Show More
Copyright and Terms & Conditions
© 2023. The Author(s). Published by the American Astronomical Society.