Image Details
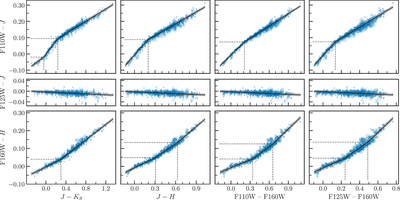
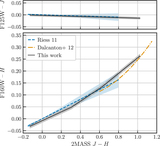
Caption: Figure 8.
Filter transformation fits to F110W – J (top row), F125W – J (center row), and F160W – H (bottom row) as functions of J − K S , J − H, F110W – F160W, and F125W – F160W color from left to right. Points used in the fitting are shown in dark blue with light blue covariance ellipses. Solid black lines show the resulting piecewise linear transformations with 68% confidence intervals in gray, and dashed black lines mark the break-point locations.
Other Images in This Article
Show More
Copyright and Terms & Conditions
© 2023. The Author(s). Published by the American Astronomical Society.
Copyright ©
2026 Astronomy Image Explorer. All Rights Reserved.