Image Details
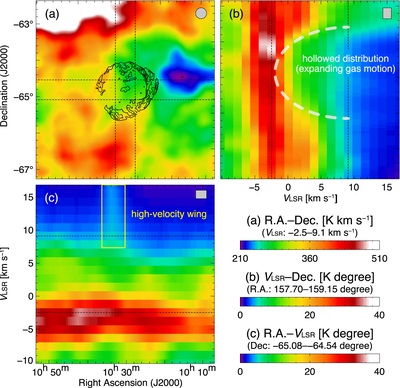
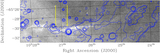
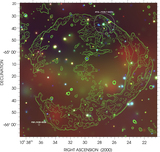
Caption: Figure 6.
(a) Intensity distribution of H I obtained from HI4PI (HI4PI Collaboration et al. 2016). The integration velocity range is from −2.5 to 9.1 km s−1. The superposed contours indicate the intensity of the radio continuum. (b–c) Position–velocity diagrams of H I. The H I intensity is integrated from 157.°70 to 159.°15 in R.A. for panel (b) and from −65.°08 to −64.°54 in decl. for panel (c). The white dashed curve and yellow solid box in the position–velocity diagrams indicate candidates of a H I expanding shell and a high-velocity wing (see the text).
Other Images in This Article

Copyright and Terms & Conditions
© 2023. The Author(s). Published by the American Astronomical Society.
Copyright ©
2026 Astronomy Image Explorer. All Rights Reserved.