Image Details
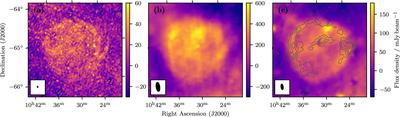
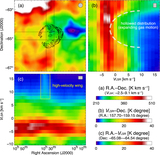
Caption: Figure 2.
2.°5 × 2.°5 region surrounding G288.8–6.3 at (a) MWA 200 MHz, (b) CHIPASS 1400 MHz, and (c) S-PASS 2300 MHz after source and background subtraction as described in Section 4.1. The contours in panel (c) show the total linear polarization measured in S-PASS, in steps of 4× the local rms noise, 38 μJy beam−1. The FWHM of the point-spread function is shown as a solid black ellipse in the lower left corner of each panel.
Other Images in This Article

Copyright and Terms & Conditions
© 2023. The Author(s). Published by the American Astronomical Society.
Copyright ©
2026 Astronomy Image Explorer. All Rights Reserved.