Image Details
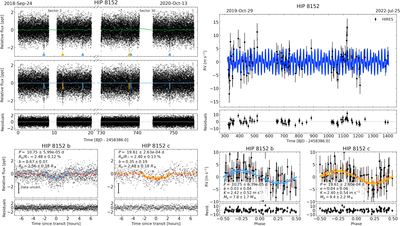
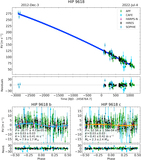
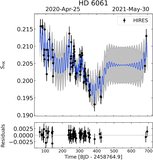
Caption: Figure 6.
Our joint modeling results for HIP 8152. Left: the photometric model. The top panel shows the PDCSAP light curve as the black points, with the GP used to flatten the light curve plotted as the green line. Triangles mark transits for planets b (blue) and c (orange). The middle panel shows the flattened light curve in black and the best-fitting transit models for planets b and c in blue and orange, respectively. Residuals are shown below. Phase-folded light curves and residuals are shown in the bottom panels for planets b (left) and c (right), with data in 30 minute bins shown in red. The phase-folded best-fitting transit models for each planet are shown as the slightly thicker blue and orange lines, with 25 random posterior draws overplotted as the thinner lines. Right: the RV model. The top panel shows the RV time series with Keck-HIRES data in black and the RV model in blue. Residuals are shown below. Phase-folded RV curves for planets b and c are shown in the bottom panels. Red points are data binned in 0.125 units of orbital phase. The phase-folded best-fitting RV models for each planet are shown as the slightly thicker blue and orange lines, with 25 random posterior draws overplotted as the thinner lines.
Other Images in This Article
Show More
Copyright and Terms & Conditions
© 2023. The Author(s). Published by the American Astronomical Society.