Image Details
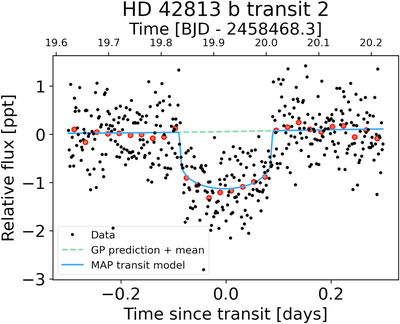
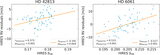
Caption: Figure 5.
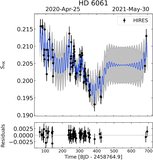
An example of our simultaneous transit and GP fitting for the second transit of HD 42813 b in Sector 6. The PDCSAP data are shown in black, and data in 30 minute bins are shown in red. The GP prediction across the transit (plus a small global offset fit to the data) is shown as the green dashed line, and the best-fitting transit model is shown as the blue line. We visually inspected each transit across all systems to ensure that the GP prediction did not absorb any of the transit signal.
Other Images in This Article
Show More
Copyright and Terms & Conditions
© 2023. The Author(s). Published by the American Astronomical Society.
Copyright ©
2026 Astronomy Image Explorer. All Rights Reserved.