Image Details
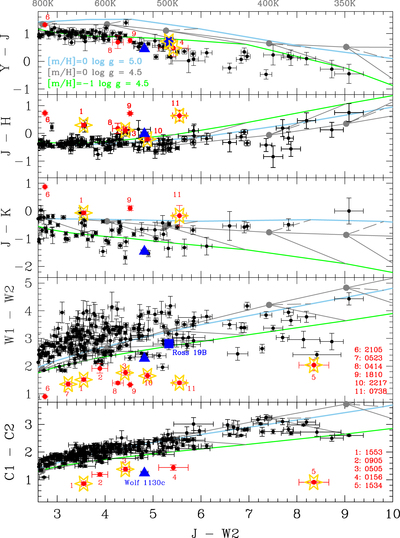
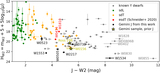
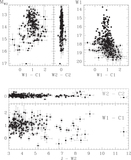
Caption: Figure 2.
Color–color plots for T and Y dwarfs. The upward blue triangle (blue square) is the metal-poor benchmark T dwarf Wolf 1130C (Ross 19B). These two benchmark systems have metallicities of −0.75 and −0.40 dex, respectively (see Sections 2.1 and 2.2). Red points are (candidate) metal-poor brown dwarfs, identified by red text annotations in the bottom two panels. Red points with surrounding yellow stars represent objects for which we present new Gemini photometry. The gray lines connecting filled gray circles are solar-metallicity model sequences with log g = 4.5; the dots indicate the colors for the T eff values shown along the top axis. Light blue lines are also solar-metallicity sequences, but these have a higher gravity of log g = 5.0, implying a higher mass and older age for a given T eff (e.g., Figure 10 of Marley et al. 2021). Light green lines have log g = 4.5 and a metallicity of one-tenth solar. Gray dashed lines between the gray and blue sequences indicate the effect of increasing gravity at constant T eff, and gray solid lines between the gray and green sequences indicate the effect of decreasing metallicity at constant T eff. See Section 4.1 for a description of the models used in this figure, and Section 4.2 for a discussion of the observed trends.
Other Images in This Article
Copyright and Terms & Conditions
© 2023. The Author(s). Published by the American Astronomical Society.