Image Details
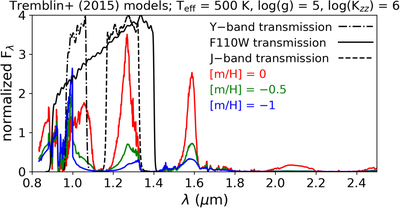
Caption: Figure 7.
A metallicity sequence of models from Tremblin et al. (2015). All models have T eff = 500 K, log(g) = 5, and log(K zz ) = 6. Red, green, and blue lines are the [m/H] = 0, −0.5, and −1 dex models, respectively. All models are normalized to unity between 0.91 and 0.925 μm. The dotted–dashed black line shows the Gemini/Flamingos-2 Y-band transmission, the thin solid black line shows the F110W transmission, and the dashed black line provides the MKO J-band transmission. These transmission curves are displayed here with normalizations such that each has a maximum value of 4. As metallicity decreases, the J-band peak is dramatically suppressed such that a bluer color arises within the 0.9–1.4 μm wavelength range. Thus, the Tremblin et al. (2015) models appear qualitatively in alignment with the relatively blue F110W − J color of WISEA 1534−1043.
Other Images in This Article
Copyright and Terms & Conditions
© 2023. The Author(s). Published by the American Astronomical Society.