Image Details
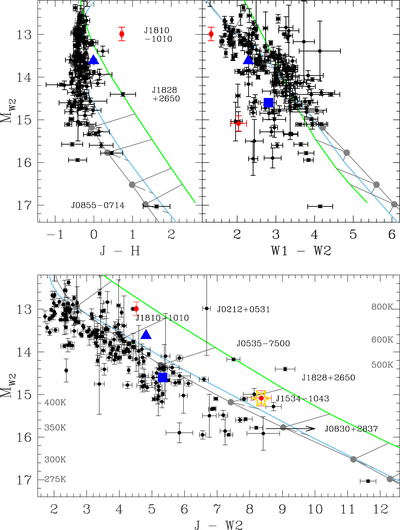
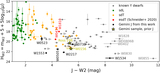
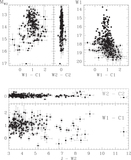
Caption: Figure 3.
Color–magnitude plots for T and Y dwarfs. The upward blue triangle (blue square) is the metal-poor benchmark T dwarf Wolf 1130C (Ross 19B). Outliers are identified. We present new J-band photometry for WISEA 1534−1043 in this work (red dot with surrounding yellow star). Red dots without a yellow star are data points from the prior literature for metal-poor brown dwarf candidates. The black arrow in the bottom panel illustrates the lower limit on J − W2 from Bardalez Gagliuffi et al. (2020) for WISEA 0830+2837. J0212+0531 is CWISEP J021243.55+053147.2 (Meisner et al. 2020a; Leggett et al. 2021). J0535−7500 is WISE J053516.80−750024.9 (Kirkpatrick et al. 2012). J1828+2650 is WISEPA J182831.08+265037.8 (Cushing et al. 2011; Kirkpatrick et al. 2011). Model sequences are shown as gray, blue, and green lines, as described in Figure 2. Gray filled circles on the gray sequence correspond to the colors for the T eff values shown on the left and right axes in the lower panel.
Other Images in This Article
Copyright and Terms & Conditions
© 2023. The Author(s). Published by the American Astronomical Society.