Image Details
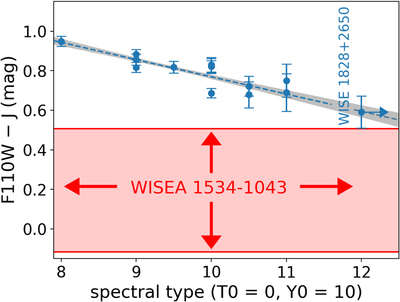
Caption: Figure 6.
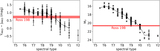
The F110W − J color of WISEA 1534−1043 (red shaded region) compared to F110W − J color synthesized from Hubble Space Telescope spectroscopy of 14 late T and Y dwarfs (blue data points; Cushing et al. 2011, 2014, 2021; Kirkpatrick et al. 2012; Schneider et al. 2015). There is a roughly linear trend between F110W − J color and numerical spectral type (T0 = 0, Y0 = 10). The blue dashed line shows a linear fit to the comparison sample (excluding W1534) and the gray envelope shows the 1σ linear fit confidence interval. The Pearson correlation coefficient of the comparison sample in terms of F110W − J vs. spectral type is −0.89, indicating a strong negative correlation. W1534 has a bluer F110W − J color than the other late T and Y dwarfs, such that the 1σ upper envelope of its F110W − J color remains bluer than the bluest F110W − J color in the comparison sample. This indicates that WISEA 1534−1043 has an unusual spectrum in the 0.9–1.4 μm range relative to the known population of brown dwarfs currently thought to be similar in temperature.
Other Images in This Article
Copyright and Terms & Conditions
© 2023. The Author(s). Published by the American Astronomical Society.