Image Details
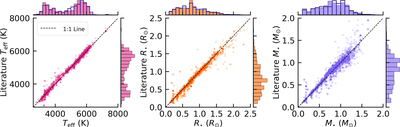
Caption: Figure 4.
Comparison of our T eff, R ⋆, and M ⋆ measurements to those of confirmed exoplanet systems from the literature. Above each plot is the histogram of our measured values, and to the right of each plot is a histogram of the literature measured values. For direct comparison, the dark blue histogram outlines of the literature values are plotted over our measured values. Compared to literature values, our measurements have average differences of 1% in T eff 3% in R ⋆, and 5.5% in M ⋆.
Other Images in This Article
Show More
Copyright and Terms & Conditions
© 2023. The Author(s). Published by the American Astronomical Society.