Image Details
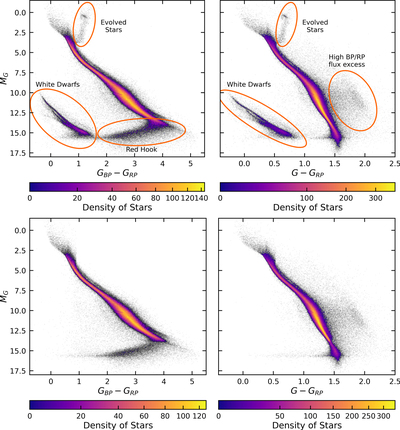
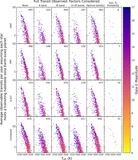
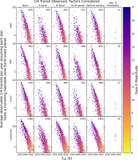
Caption: Figure 1.
Color–magnitude diagrams of GCNS targets. The upper two panels show all GCNS targets with G, G BP, and G RP measurements. Red ellipses indicate the locations of evolved stars and white dwarfs in both plots, the red hook in the G BP − G RP plot, and a region of high BP/RP flux excess in the G − G RP plot. The lower two panels show only the main-sequence stars used in this study.
Other Images in This Article
Show More
Copyright and Terms & Conditions
© 2023. The Author(s). Published by the American Astronomical Society.
Copyright ©
2025 Astronomy Image Explorer. All Rights Reserved.