Image Details
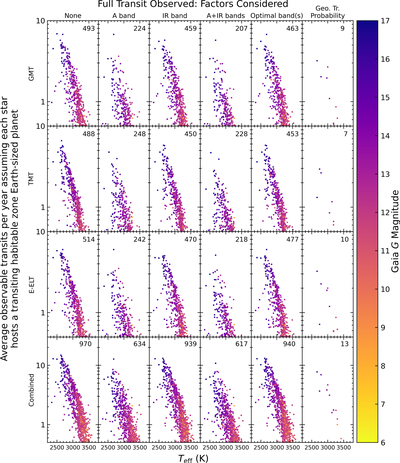
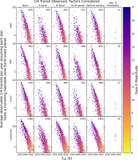
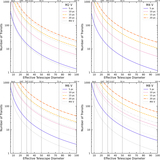
Caption: Figure 7.
Assuming each star hosts a transiting habitable-zone Earth-sized planet amenable to O2 observations from ground-based ELTs, this plot shows the average number of observable transits per year as a function of stellar effective temperature. The top three rows show observability from the three different ELTs, and the bottom row shows the combined total number of transits computed from the sum of the values for each star from each ELT. Each column shows different observability factors considered including no accounting for relative system velocity (None), accounting for system relative velocity at the time of observation for separate A and IR bands, when both A and IR are observable, optimal O2 band (maximum of A, IR, or A+IR), and geometric transit probability. The last column is a random subsample of 13 targets, which was selected based on the median geometric transit probability of 1.27% of the 970 targets with the number of observable transits (from the first column) greater than 0.5. The total number of targets for each scenario is indicated in the upper right corner of each cell. Points are colored by apparent Gaia G-band magnitude.
Other Images in This Article
Show More
Copyright and Terms & Conditions
© 2023. The Author(s). Published by the American Astronomical Society.