Image Details
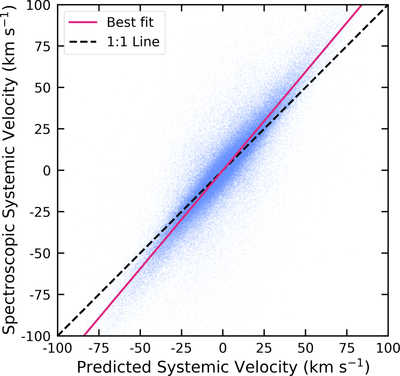
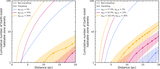
Caption: Figure 2.
Comparison between spectroscopic and predicted systemic velocity measurements from random forest regression. A 1:1 correlation is shown as a dashed black line, and the line of best fit through the data is shown as a solid pink line. We used the line of best fit to apply an offset to all predicted systemic velocity measurements without spectroscopic measurements.
Other Images in This Article
Show More
Copyright and Terms & Conditions
© 2023. The Author(s). Published by the American Astronomical Society.
Copyright ©
2025 Astronomy Image Explorer. All Rights Reserved.