Image Details

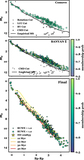
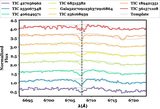
Caption: Figure 10.
TESS light curves for Sectors (from top to bottom) 11, 12, 38, and 39. Data for each sector is shown as gray dots, and binned values are shown as black dots. The blue line indicates the model GP fit to the data with uncertainties (shaded region). The times of the transits are marked with dashed and dotted vertical lines for planets (b) and (c), respectively.
Other Images in This Article

Show More
Copyright and Terms & Conditions
© 2023. The Author(s). Published by the American Astronomical Society.
Copyright ©
2026 Astronomy Image Explorer. All Rights Reserved.