Image Details
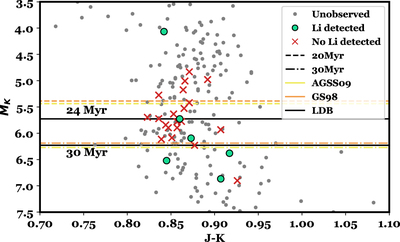
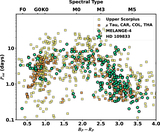
Caption: Figure 6.
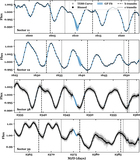
The lithium-depletion boundary (LDB) of MELANGE-4. Shown is the color (J − K) and absolute magnitude (K s ) of members of MELANGE-4. Observed stars with EW(Li) > 300 mÅ are shown as colored dots, and stars with EW(Li) < 300 mÅ as red X’s. Candidate association members that were not observed are shown as gray dots. Orange and yellow lines show the predicted 20 and 30 Myr 99% LDBs using the DSEP magnetic models with two different solar abundances. The 30 Myr GS98 line has been moved up by 0.03 magnitudes to increase visibility. The solid black lines through the brightest M-dwarf with Li absorption, and the faintest likely member without Li absorption show the edges of the boundary region.
Other Images in This Article

Show More
Copyright and Terms & Conditions
© 2023. The Author(s). Published by the American Astronomical Society.