Image Details
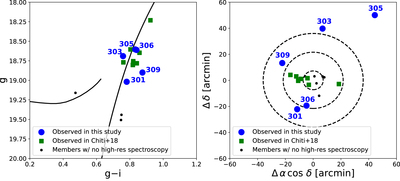
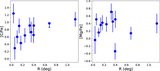
Caption: Figure 1.
Left: color–magnitude diagram of stars in the Tucana II UFD. Blue circles correspond to stars observed with high-resolution spectroscopy presented in this work; green squares correspond to stars with high-resolution spectroscopy presented in previous works (Ji et al. 2016b; Chiti et al. 2018a); black circles correspond to stars with no high-resolution spectroscopy (Walker et al. 2016; Chiti et al. 2021). A MIST isochrone of 10 Gyr and [Fe/H] = −2.2 (Paxton et al. 2011, 2013, 2015; Choi et al. 2016; Dotter 2016; Paxton et al. 2018) is overplotted at the distance modulus of Tucana II (m − M = 18.8; Bechtol et al. 2015), for reference. Each star observed in this study is labeled by its identifier in Table 1. Right: spatial location of stars with respect to the center of Tucana II. Dashed circles correspond to 1, 3, and 5 times the half-light radius as presented in Bechtol et al. (2015).
Other Images in This Article
Copyright and Terms & Conditions
© 2023. The Author(s). Published by the American Astronomical Society.