Image Details
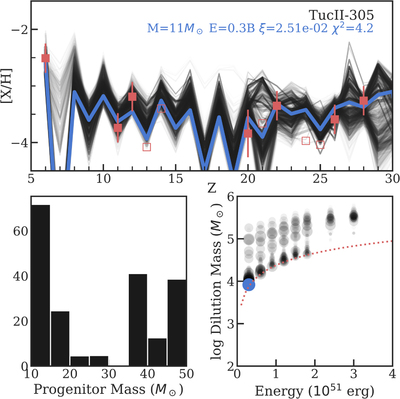
Caption: Figure 8.
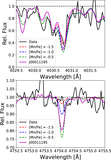
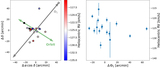
Top panel: abundance pattern of TucII-305 (red squares) with the best-fitting SN yield model (blue) and other SN yield models within 2σ of the best-fitting χ 2 value (gray) overplotted. The best-fitting progenitor SN is low mass (∼11 M ⊙) and low energy (E ∼ 0.3 × 1051 ergs), though the abundances are consistent with a broad range of acceptable parameters. Bottom left panel: distribution of the progenitor masses of consistent models. While there is a preference for low masses, the range of acceptable masses does extend to the high-mass regime. Bottom right panel: dilution mass vs. explosion energy of the models with the best-fitting model shown in blue. The red dashed line indicates the minimum dilution mass for the given SN energy (see Section 5.2 in Ji et al. 2020b); models below this line are excluded.
Other Images in This Article
Copyright and Terms & Conditions
© 2023. The Author(s). Published by the American Astronomical Society.