Image Details
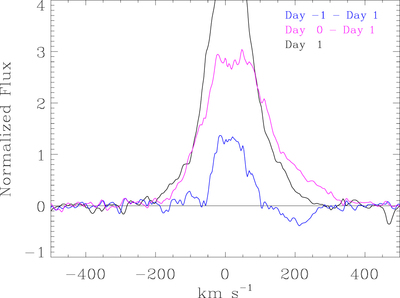
Caption: Figure 4.
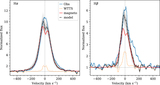
An Hα profile and two residual profiles from the three CHIRON spectra obtained on a daily cadence. These were obtained approximately 12 hr before, 12 hr after, and 36 hr after the HST spectra. We refer to these as days −1, 0, and +1, respectively. The black spectrum is the continuum-subtracted profile of Hα on day 1, 1.5 days after the HST observations (day 1). This profile is symmetric; we use it as a reference. This line flux peaks at 6.3 in these units (7.3 continuum units). The other spectra are normalized to the continua, and the reference spectrum is subtracted. The residual spectrum taken before the HST observations (day –1, in blue) shows a modest flux increase near line center and an inverse P Cygni profile, suggestive of infalling gas. Twelve hours after the HST observations (day 0, magenta), the residual spectrum is brighter and broadened to the red. Figure 5 shows that the Hα emission was brighter during the UVES spectrum, obtained closer to the time of the HST spectrum. These velocities are heliocentric and are not corrected for the stellar RV, which is insignificant on this scale.
Other Images in This Article
Show More
Copyright and Terms & Conditions
© 2022. The Author(s). Published by the American Astronomical Society.