Image Details
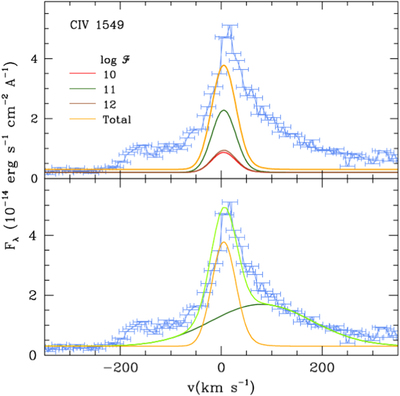
Caption: Figure 7.
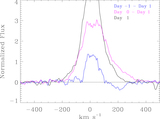
Profile of the C IV 1549 line in the CVSO 109A spectrum. The observed profile (blue) has been boxcar smoothed by 3 pixels. The upper panel shows the model line profile emitted by the postshock regions of columns with energy flux log ﹩{ \mathcal F }=10﹩ (red), 11 (green), and 12 (brown), weighted by the filling factors that explain the NUV–NIR continuum (Figure 6). The total model line profile is shown in orange. The lower panel shows again the observed profile and the total postshock emission. A Gaussian with mean RV of +80 km s−1 and width 100 km s−1 (dark green) added to the total postshock emission can approximately explain the observed profile (light green).
Other Images in This Article
Show More
Copyright and Terms & Conditions
© 2022. The Author(s). Published by the American Astronomical Society.