Image Details
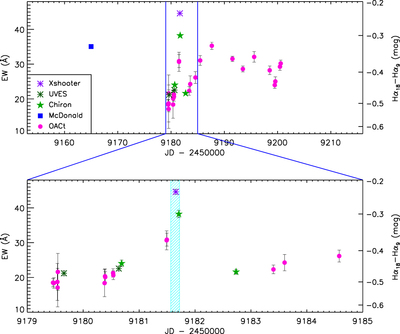
Caption: Figure 5.
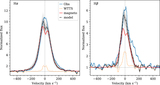
Hα EW derived from the color index measured at OACt (dots) over one month (top) and zoomed into a 15 day interval (bounded by the blue lines on the top plot) to highlight the epoch of HST observations. The scale of the color index is shown in the right vertical axis. The Hα EW measured on X-shooter, UVES, CHIRON, and McDonald spectra are overplotted with different symbols as indicated in the legend. A zoom around the HST observations (cyan hatched area) is displayed in the lower box.
Other Images in This Article
Show More
Copyright and Terms & Conditions
© 2022. The Author(s). Published by the American Astronomical Society.
Copyright ©
2025 Astronomy Image Explorer. All Rights Reserved.