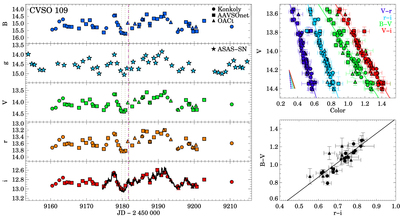
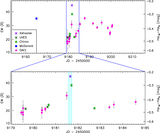
Image Details

Choose export citation format:

The ODYSSEUS Survey. Motivation and First Results: Accretion, Ejection, and Disk Irradiation of CVSO 109

  • Authors: C. C. Espaillat, G. J. Herczeg, T. Thanathibodee, C. Pittman, N. Calvet, N. Arulanantham, K. France, Javier Serna, J. Hernández, Á. Kóspál, F. M. Walter, A. Frasca, W. J. Fischer, C. M. Johns-Krull, P. C. Schneider, C. Robinson, Suzan Edwards, P. Ábrahám, Min Fang, J. Erkal, C. F. Manara, J. M. Alcalá, E. Alecian, R. D. Alexander, J. Alonso-Santiago, Simone Antoniucci, David R. Ardila, Andrea Banzatti, M. Benisty, Edwin A. Bergin, Katia Biazzo, César Briceño, Justyn Campbell-White, L. Ilsedore Cleeves, Deirdre Coffey, Jochen Eislöffel, Stefano Facchini, D. Fedele, Eleonora Fiorellino, Dirk Froebrich, Manuele Gangi, Teresa Giannini, K. Grankin, Hans Moritz Günther, Zhen Guo, Lee Hartmann, Lynne A. Hillenbrand, P. C. Hinton, Joel H. Kastner, Chris Koen, K. Maucó, I. Mendigutía, B. Nisini, Neelam Panwar, D. A. Principe, Massimo Robberto, A. Sicilia-Aguilar, Jeff A. Valenti, J. Wendeborn, Jonathan P. Williams, Ziyan Xu, and R. K. Yadav

2022 The Astronomical Journal 163 114.

  • Provider: AAS Journals

Caption: Figure 3.

Left: optical light curves of CVSO 109. Data from Konkoly Observatory, AAVSOnet, OACt, and ASAS-SN are denoted with circles, squares, triangles, and stars. Vertical dashed and dotted lines mark the epochs of HST and VLT observations. In the bottom panel, the black curve displays the TESS data. Upper right: color–magnitude diagram for CVSO 109. Lower right: color–color diagram for CVSO 109. In the right panels, lines fitted to the data points are also plotted. The short lines in the upper-right panel indicate how an increase of 0.2 mag in AV would change the colors for R = 3.1 (solid lines) or for R = 5 (dotted lines).

Other Images in This Article

Show More

Copyright and Terms & Conditions