Image Details
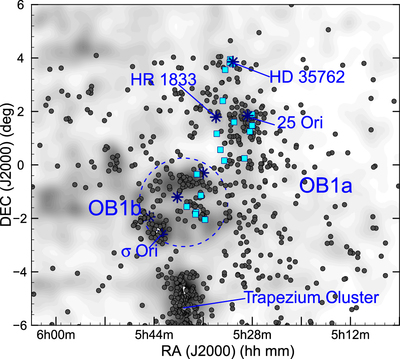
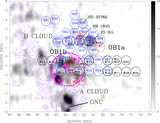
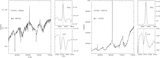
Caption: Figure 7.
Spatial distribution of TTSs confirmed through FAST and SOAR-Goodman spectroscopy. FAST-confirmed TTSs are indicated with dark dots, while those identified in SOAR-Goodman spectra are plotted as cyan squares. The grayscale background is the surface density of photometric candidate PMS stars in our sample CS2. The main stellar groups and regions are labeled, both the known groups and the new ones discussed in this work.
Other Images in This Article
Show More
Copyright and Terms & Conditions
© 2019. The American Astronomical Society. All rights reserved.
Copyright ©
2026 Astronomy Image Explorer. All Rights Reserved.