Image Details
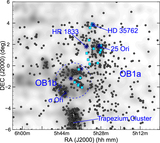
Caption: Figure 6.
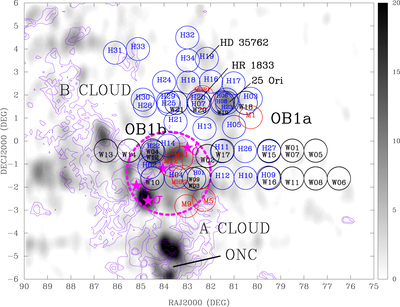
Schematic distribution of our Hectospec, Hydra, and M2FS observations. Circles labeled “H” in blue correspond to the Hectospec fields, “W” black labels to Hydra, and “M” red labels to the M2FS fields (see Table 2). Some fields were observed with both Hydra and Hectospec, so they have both blue and black labels. The grayscale map is the surface density of a candidate TTS in sample CS2, per ﹩1\buildrel{\,\prime}\over{.} 6\times 2\buildrel{\,\prime}\over{.} 6﹩. Contours show the integrated 13CO emissivity of the Orion A and B molecular clouds (Bally et al. 1987), covering the range from 0.5 to 20 K km s−1. The circular dashed region indicates our definition of the Orion OB1b association, as described in B05. The solid starred symbols mark the positions of the Orion belt stars and σ Ori. The locations of the 25 Ori cluster and the new TTS clusterings HR 1833 and HD 35762 (see Section 3.6) are also indicated.
Other Images in This Article
Show More
Copyright and Terms & Conditions
© 2019. The American Astronomical Society. All rights reserved.