Image Details
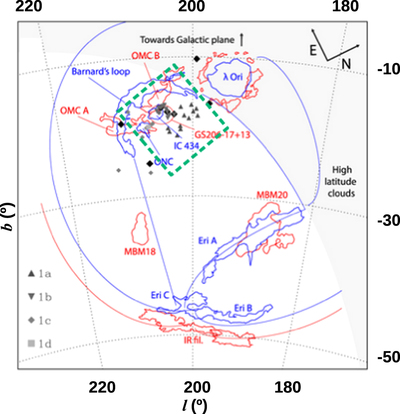
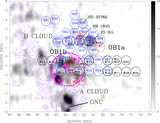
Caption: Figure 2.
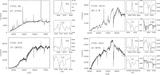
The outline of the CVSO survey area (green dashed-line rectangle) projected in galactic coordinates and overlaid on the large-scale structure of the Orion–Eridanus super bubble, as depicted schematically by Ochsendorf et al. (2015) in their Figure 1(d). The solid red lines map the dust structures, while the blue lines correspond to the rough outlines of gas structures traced by Hα emission (adapted from Ochsendorf et al. 2015).
Other Images in This Article

Show More
Copyright and Terms & Conditions
© 2019. The American Astronomical Society. All rights reserved.
Copyright ©
2026 Astronomy Image Explorer. All Rights Reserved.