Image Details
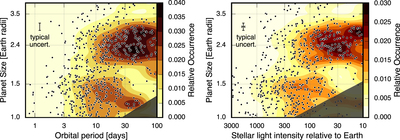
Caption: Figure 6.
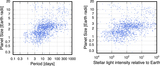
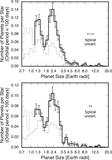
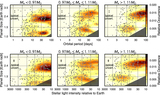
Left: two-dimensional distribution of planet size and orbital period. The median uncertainty is plotted in the upper left. Right: same as left but with insolation flux on the horizontal axis. In both plots, the two peaks in the population as observed by F17 are clearly visible, but with greater fidelity.
Other Images in This Article
Copyright and Terms & Conditions
© 2018. The American Astronomical Society. All rights reserved.
Copyright ©
2026 Astronomy Image Explorer. All Rights Reserved.