Image Details
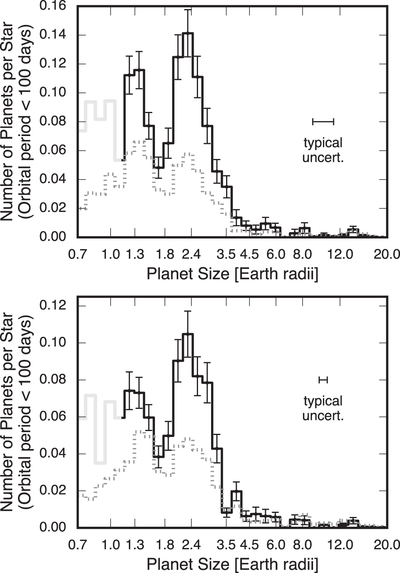
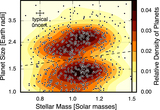
Caption: Figure 5.
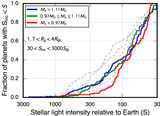
The distribution of close-in planet sizes. The top panel shows the distribution from Fulton et al. (2017) and the bottom panel is the updated distribution from this work. The solid line shows the number of planets per star with orbital periods less than 100 days as a function of planet size. A deep trough in the radius distribution separates two populations of planets with ﹩{R}_{p}﹩ > 1.7 ﹩{R}_{\oplus }﹩ and ﹩{R}_{p}﹩ < 1.7 ﹩{R}_{\oplus }﹩. As a point of reference, the dotted line shows the size distribution of detected planets, before completeness corrections are made arbitrarily scaled for visual comparison.
Other Images in This Article
Copyright and Terms & Conditions
© 2018. The American Astronomical Society. All rights reserved.