Image Details
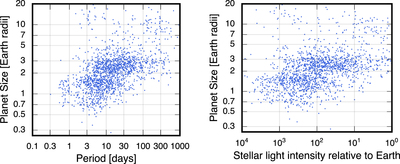
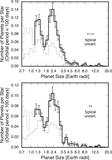
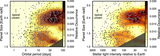
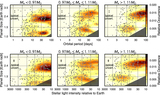
Caption: Figure 4.
Left: distribution of planet radii and orbital periods. Right: same as left but with insolation flux relative to Earth on the horizontal axis. In both plots, an underdensity of points appears between 1.5 and 2.0 ﹩{R}_{\oplus }﹩.
Other Images in This Article
Copyright and Terms & Conditions
© 2018. The American Astronomical Society. All rights reserved.
Copyright ©
2026 Astronomy Image Explorer. All Rights Reserved.