Image Details
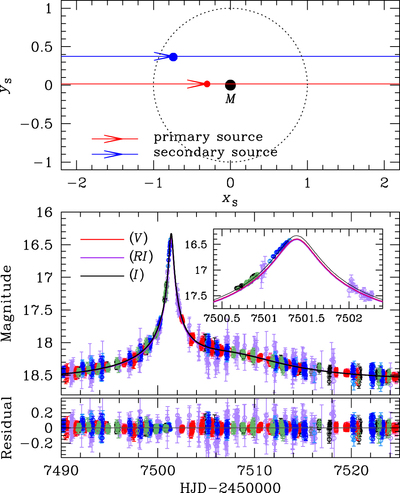
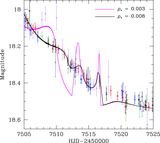
Caption: Figure 5.
Geometry and light curve of the binary-source model. (1) The upper panel shows the geometry of the binary-source model. Two straight lines with arrows are the source trajectories of individual source stars. The lens is located at the origin (marked by M), and the dotted circle is the angular Einstein ring. The red and blue filled circles represent the individual source positions at ﹩\mathrm{HJD}^{\prime} =7497﹩. Lengths are normalized by the Einstein radius. (2) The lower panel shows the enlarged view of the anomaly region. The two curves with different colors are best-fit binary-source models for RI and I passbands. The inset shows a zoom of the anomaly near ﹩\mathrm{HJD}^{\prime} \sim 7501.4﹩. We note that, although we only use the V-band data for determining the source type, we also present the V-band model light curve to compare the color change between passbands.
Other Images in This Article
Copyright and Terms & Conditions
© 2017. The American Astronomical Society. All rights reserved.