Image Details
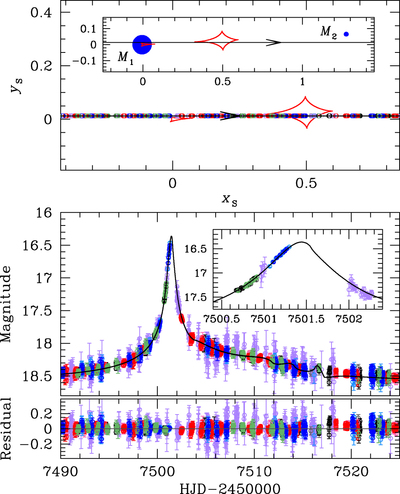
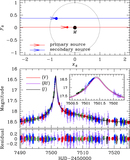
Caption: Figure 3.
Geometry and light curve of the binary-lens model. (1) The upper panel shows the geometry of the binary-lens model. The straight line with an arrow is the source trajectory, red closed concave curves represent the caustics, and blue filled circles (marked by M1 and M2) are the binary-lens components. All length scales are normalized by the Einstein radius. The inset shows the general view and the major panel shows the enlarged view corresponding to the light curve of the lower panel. The open circle on the source trajectory is the source position at the time of observation whose size represents the source size. (2) The lower panel shows the enlarged view of the anomaly region. The inset shows a zoom of the light curve near ﹩\mathrm{HJD}^{\prime} \sim 7501.4﹩. The curve superposed on the data is the best-fit binary-lens model.
Other Images in This Article
Copyright and Terms & Conditions
© 2017. The American Astronomical Society. All rights reserved.