Image Details
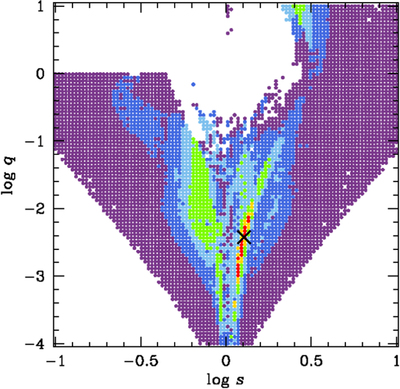
Caption: Figure 2.
﹩{\rm{\Delta }}{\chi }^{2}﹩ surface of ﹩(s,q)﹩ parameter space derived from the initial grid search. Each color represents the contour level of ﹩{\rm{\Delta }}{\chi }^{2}\lt 20\sigma ﹩ (red), ﹩\lt 40\sigma ﹩ (yellow), ﹩\lt 60\sigma ﹩ (green), ﹩\lt 80\sigma ﹩ (light blue), ﹩\lt 100\sigma ﹩ (blue), and ﹩\lt 120\sigma ﹩ (purple), respectively. The location of the best-fit solution is marked by the cross symbol.
Other Images in This Article
Copyright and Terms & Conditions
© 2017. The American Astronomical Society. All rights reserved.
Copyright ©
2026 Astronomy Image Explorer. All Rights Reserved.