Image Details
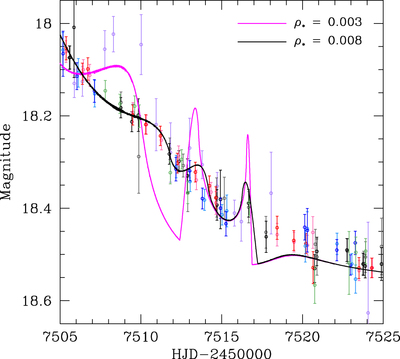
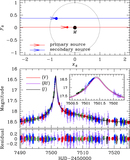
Caption: Figure 4.
Comparison of two binary-lens models in the weak anomaly region. The black and magenta curves represent, respectively, the best-fit model and the same model except with a substantially smaller (and more typical) source size ﹩{\rho }_{* }﹩. Each data set is binned in time intervals of ﹩24\,\mathrm{hr}﹩, each of which contains a maximum of 10 hr of contiguous data.
Other Images in This Article
Copyright and Terms & Conditions
© 2017. The American Astronomical Society. All rights reserved.
Copyright ©
2026 Astronomy Image Explorer. All Rights Reserved.