Image Details
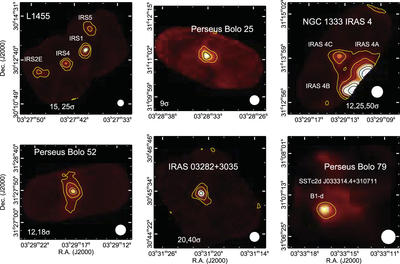
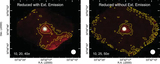
Caption: Figure 32.
SHARC-II 350 μm Lissajous maps of the targets listed in Table 6 (targets observed in both the Lissajous and box-scan observing modes), here L1455 (1σ = 0.137 Jy beam−1, min = −0.6 Jy beam−1, max = 4.0 Jy beam−1), Perseus Bolo 25 (1σ = 0.040 Jy beam−1, min = −0.2 Jy beam−1, max = 0.6 Jy beam−1), NGC 1333 IRAS 4 (1σ = 0.341 Jy beam−1, min = −0.6 Jy beam−1, max = 4.8 Jy beam−1), Perseus Bolo 52 (1σ = 0.098 Jy beam−1, min = −0.5 Jy beam−1, max = 2.3 Jy beam−1), IRAS 03282+3035 (1σ = 0.169 Jy beam−1, min = −0.6 Jy beam−1, max = 5.0 Jy beam−1), and Perseus Bolo 79 (1σ = 0.358 Jy beam−1, min = −0.2 Jy beam−1, max = 3.1 Jy beam−1). Maps with multiple sources have each source labeled. The beam size is shown at the lower right of each map. The two yellow contour levels are plotted at 3σ and 7σ. Additional contours are plotted in black, with the levels chosen manually for optimal visual display. These levels are printed in white text at the bottom of each panel, with no text indicating no additional black contours are plotted. Emission seen toward the edges of the maps is not reliable and should be ignored. The color scaling uses a linear intensity scale; see Figure 8 for a normalized version of the adopted color scale bar. The data behind this figure is provided as tar.gz FITS files.
Other Images in This Article

Show More
Copyright and Terms & Conditions
© 2016. The American Astronomical Society. All rights reserved.