Image Details
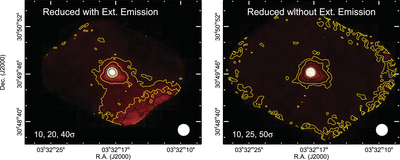
Caption: Figure 7.
IRAS 03292+3039 reduced with (left) and without (right) the extended emission flag included, with both panels displayed with a linear intensity color scale ranging from −0.4 to 3.0 Jy beam−1 (see Figure 8 for a normalized version of the color scale bar used). The two yellow contours in each panel are plotted at 3σ and 7σ, where 1σ = 0.55 Jy beam−1 in the map with the extended emission flag and 1σ = 0.15 Jy beam−1 in the map without the extended emission flag. Additional contours are plotted in black, with the levels chosen manually for optimal visual display and printed in white text in the lower left corner of each panel. The peak intensities (total flux densities in 40″ diameter apertures) are measured to be 9.6 Jy beam−1 (17.4 Jy) in the map with the extended emission flag and 10.0 Jy beam−1 (14.1 Jy) in the map without the extended emission flag.
Other Images in This Article

Show More
Copyright and Terms & Conditions
© 2016. The American Astronomical Society. All rights reserved.