Image Details
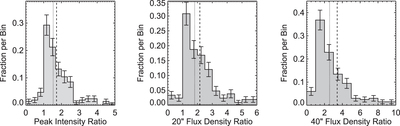
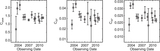
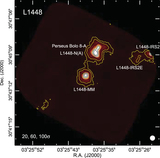
Caption: Figure 9.
Histograms for the ratios of flux densities measured in maps with the extended flag divided by those measured in maps without the extended flag, for each aperture size: the peak (beam) intensities (left), the flux densities in 20″ diameter apertures (middle), and the flux densities in 40″ diameter apertures (right). The vertical dashed lines in each panel show the mean of each distribution, and the vertical dotted lines show the medians. The error bars on each bin are the statistical (﹩\sqrt{N}﹩) uncertainties.
Other Images in This Article

Show More
Copyright and Terms & Conditions
© 2016. The American Astronomical Society. All rights reserved.
Copyright ©
2025 Astronomy Image Explorer. All Rights Reserved.