Image Details

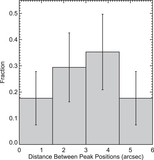
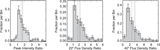
Caption: Figure 2.
Histogram showing the distance between measured peak positions for sources that were each observed twice in our Monte Carlo model, as explained in detail in the text. The mean distance is 1.2 and the median distance is 1.1 (both in arbitrary units). Since the model assumed a pointing rms of 1, we find that the mean of this distribution is 20% larger than the underlying rms of the pointing model.
Other Images in This Article

Show More
Copyright and Terms & Conditions
© 2016. The American Astronomical Society. All rights reserved.
Copyright ©
2025 Astronomy Image Explorer. All Rights Reserved.