Image Details
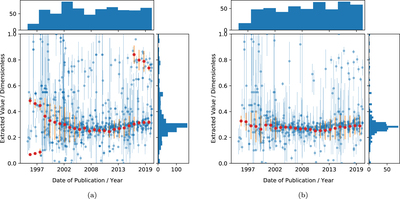
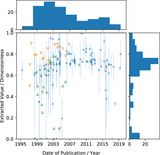
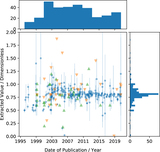
Caption: Figure 8.
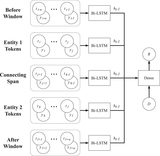
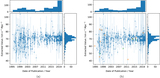
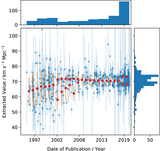
Comparison of search results for the rule-based (a) and neural (b) models for the cosmological matter density, Ω M . Both plots show only measurements that report a central value and an uncertainty (the neural model also contains constraint measurements, but these have been omitted for clarity), shown in blue. The mean (red points) and dispersion (error bars) of the Gaussian mixture models fitted on overlapping 5 yr bins are also shown.
Other Images in This Article
Show More
Copyright and Terms & Conditions
© 2023. The Author(s). Published by the American Astronomical Society.
Copyright ©
2026 Astronomy Image Explorer. All Rights Reserved.