Image Details
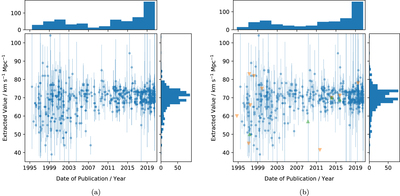
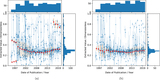
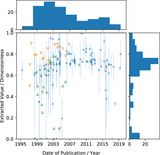
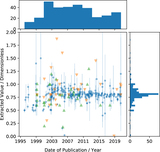
Caption: Figure 6.
Comparison of search results for the Hubble constant, H 0, from the rule-based (a) and neural models (b). In addition to the measurements provided as central values with stated uncertainties (i.e., “x ± y,” shown as blue circles with error bars), the neural model figure also shows values given in the source text as constraints (i.e., H 0 < x, or similar, shown as green arrows for lower bounds and orange arrows for upper bounds.)
Other Images in This Article
Show More
Copyright and Terms & Conditions
© 2023. The Author(s). Published by the American Astronomical Society.
Copyright ©
2026 Astronomy Image Explorer. All Rights Reserved.