Image Details
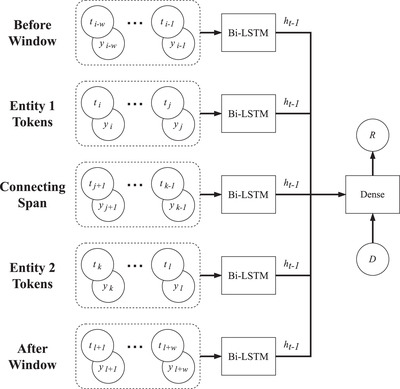
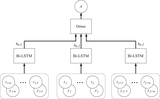
Caption: Figure 4.
A schematic diagram of the neural Relation model. The Bi-LSTM nodes shown here refer to the same LSTM network, which is used for each of the spans. Here, t n and y n indicate the token embedding and Entity label prediction for the nth token, respectively, D is the direction bit indicating the direction of the Relation in the text, R is the Relation prediction for this Entity pair and direction, and w is the window width. The two Entities in question run from tokens i to j, and from tokens k to l. The h t−1 notations indicate that it is the hidden state from the final time step that is used as the output from the LSTM nodes.
Other Images in This Article
Show More
Copyright and Terms & Conditions
© 2023. The Author(s). Published by the American Astronomical Society.