Image Details
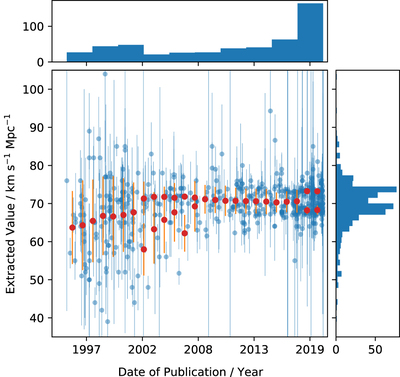
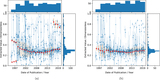
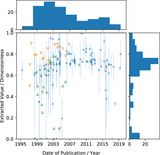
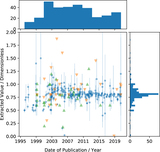
Caption: Figure 7.
Time series of the search results for H 0, showing reported value against publication date (blue), along with the mean (red points) and dispersion (error bars) of the fitted Gaussian distributions for overlapping 5 yr periods.
Other Images in This Article
Show More
Copyright and Terms & Conditions
© 2023. The Author(s). Published by the American Astronomical Society.
Copyright ©
2026 Astronomy Image Explorer. All Rights Reserved.