Image Details
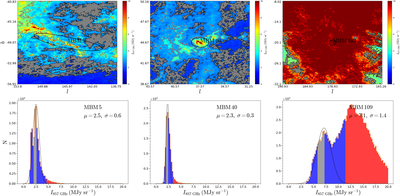
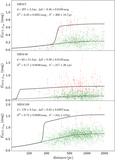
Caption: Figure 3.
The studied area (top) and histogram (bottom) of I 857GHz(MJy sr−1) in MBM 5 (left), MBM 40 (middle), and MBM 109 (right). In the studied area, the gray filled region bordered by a black dashed line is the background region, and the green–yellow–red region bordered by the red dashed line region inside the MBM cloud region (black solid line) is the cloud region. In the histogram, the black dashed curve is the local Gaussian fit, where the blue bars represent the noise (left) and transition (right) region, the gray bars represent the background region sources and the red bars represent the cloud region sources.
Other Images in This Article
Show More
Copyright and Terms & Conditions
© 2021. The Author(s). Published by the American Astronomical Society.