Image Details
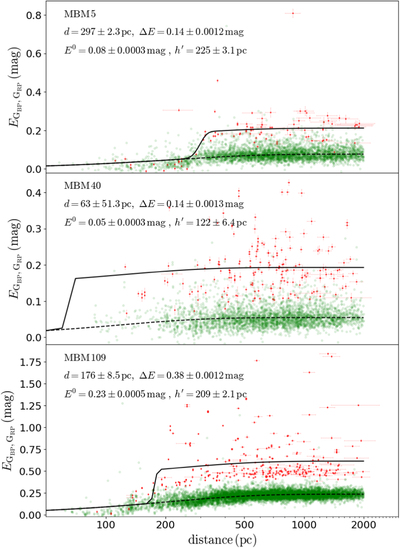
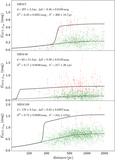
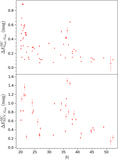
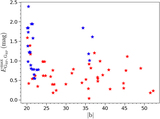
Caption: Figure 4. Color Excess Fitting
The complete figure set (11 images) is available in the online journal.
The fitting to the color excess, ﹩{E}_{{{\rm{G}}}_{\mathrm{BP}},{{\rm{G}}}_{\mathrm{RP}}}﹩, variation with the distance to the stars in the reference (green dots) and the cloud (red dots) region for the three typical clouds MBM 5, MBM 40, and MBM 109 with the extinction−distance model (Equations (1), (2), and (3). The parameters derived are shown in the upper-left corner, where “d” is the distance, “ΔE” is the color excess jump (﹩{\rm{\Delta }}{E}_{{{\rm{G}}}_{\mathrm{BP}},{{\rm{G}}}_{\mathrm{RP}}}^{\mathrm{MC}}﹩), and E 0 and ﹩h^{\prime} ﹩ are the foreground parameters of the molecular cloud (﹩{E}_{{{\rm{G}}}_{\mathrm{BP}},{{\rm{G}}}_{\mathrm{RP}}}^{0}﹩ and ﹩{h}_{{{\rm{G}}}_{\mathrm{BP}},{{\rm{G}}}_{\mathrm{RP}}}^{{\prime} }﹩). (An extended version of this figure for all the studied clouds is available online).
Other Images in This Article
Show More
Copyright and Terms & Conditions
© 2021. The Author(s). Published by the American Astronomical Society.