Image Details
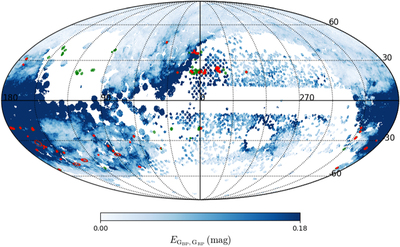
Caption: Figure 1.
Distribution of the MBM molecular clouds (ellipses) in the extinction map (blue background) expressed as ﹩{E}_{{{\rm{G}}}_{\mathrm{BP}},{{\rm{G}}}_{\mathrm{RP}}}﹩ from Paper I, where the red and green ellipses represent the molecular clouds within and outside the extinction map respectively.
Other Images in This Article
Show More
Copyright and Terms & Conditions
© 2021. The Author(s). Published by the American Astronomical Society.
Copyright ©
2026 Astronomy Image Explorer. All Rights Reserved.