

Image Details
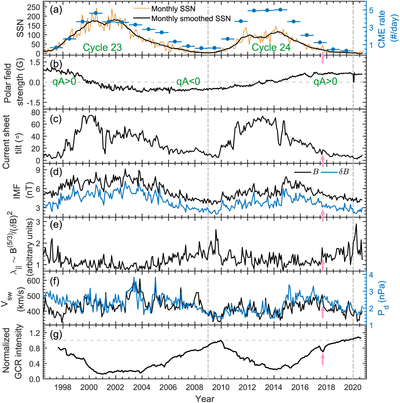
Caption: Figure 7.
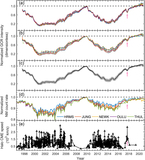
The 27 day averaged solar wind/interplanetary parameters from 1996 to 2020. (a) Sunspot number and annual CME rate. (b) Mean solar polar field strength. (c) HCS tilt angle. (d) IMF magnitude B and its root mean square δB. (e) Estimated parallel MFP λ∥. (f) Solar wind speed (black curve) and dynamic pressure (cyan curve). (g) The 69.4–237.9 MeV nuc−1 GCR oxygen intensity from ACE/CRIS (normalized to the solar minimum P23/24), and the horizontal dashed line represents the normalized GCR intensity equal to 1. The pink-arrow dip in the GCR intensity was caused by CMEs (see Section 3.4 for details).
Other Images in This Article
Copyright and Terms & Conditions
© 2021. The American Astronomical Society. All rights reserved.

Copyright ©
2026 Astronomy Image Explorer. All Rights Reserved.
